Strong and loud is the call for simple metrics. Metrics which make intuitive sense to managers and investors. Metrics like churn rate (% of customers leaving the company in a certain period), are therefore common practice in business. But common practice is wrong. Simplicity should not take precedence over the primary function of a metric. A metric should provider a shortcut for understanding how the business is doing. And overall churn rate is simple, but it’s NOT reflective of how the business is doing.
Declining overall churn effect (DOCE)
A recent study by McCarthy et al on 25 young SAAS businesses proposes that a declining overall churn rate is a consequence of the product lifecycle and not NOT a sign of improving retention rates. Wait what, how is this possible? Two words, aggregation bias. Aggregation bias occurs when data is combined or averaged in a way that masks information or creates misleading results. And this is certainly the case here. To illustrate how things go sideways when aggregating overall churn (entire customer base), let’s look at the churn rate of Hubble, a popular direct-to-consumer (DTC) brand selling contact lenses online. Churn of Hubble can be computed at the three levels
- Customer: what is the propensity of and individual customer churning?
- Cohort: How many customer left from a cohort ( for example January 2023)?
- Company: How many customers left compared to the entire customers base?
Below you see the overall churn plotted against the one-month churn rate. The difference is in the denominator, the overall churn rate (in black) is calculated using ALL customers who were subscribed in the prior period, while the one-month churn rate (in blue) is calculated using all customers acquired in the PRECEDING PERIOD.
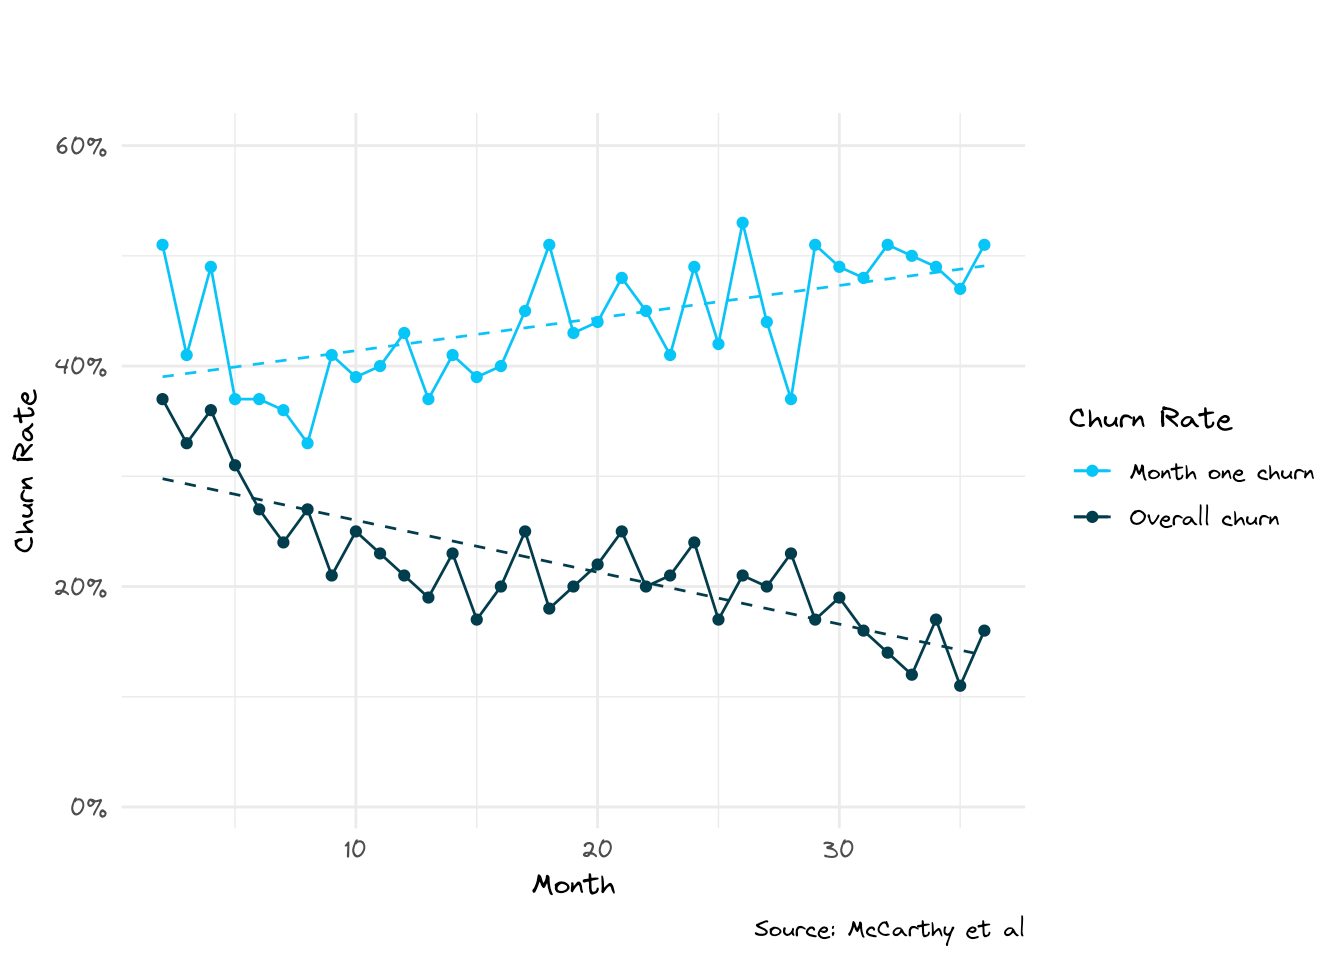
The diverging trends (dashed lines) show that the overall churn rate is declining, while the one-month churn rate is increasing (this holds for 3 and 6 month churn rates equally). This is a clear example of what the authors refer to as the declining overall churn effect (DOCE). DOCE denotes that the overall churn rate for a growing product is likely to decrease over the product lifecycle without any improvement or intervention from the company. An overall declining churn is due to nature, not nurture. It is a given, and not a sign of improving unit economics of the business.
Three effects playing into DOCE
The authors identify three competing factors which play into declining overall churn rate.
The three effects responsible for the Declining Overall Churn Effect (DOCE) are as follows:
- Falling Hazard Effect: This effect is driven by the cohort-specific hazard curve, which shows how the probability of churn in each month evolves after customer acquisition. As the mix of customers shifts towards customers with higher tenures over the brand’s life-cycle, the overall hazard rate will move down over time, driving the overall churn rate down with it.
- Acquisition Growth Effect: Larger recently acquired cohorts shift the composition of active customers towards lower-tenure customers. If these brands are characterized by a falling hazard rate as a function of tenure, a sharp increase in customer acquisition will increase the overall churn rate on the margin.
- Cross-Cohort Effect: Cross-cohort retention trends genuinely reflect changes in a business’ underlying health, as they drive changes in customer lifetime value (CLV) across acquisition cohorts through changes in cohort-specific retention curves.
The authors conclude that the most important effect causing DOCE is the falling hazard effect. The falling hazard effect is a structural property of subscription-based businesses. As customers become more familiar with a product or service and invest more time and money into it, they are less likely to churn.
Downstream impact
Overall churn rate is often an input to customer lifetime value (CLV) calculations (which is not the way to do it, but that’s another post). Many investors and entrepreneurs view Cost of Acquisition (CAC) to CLV ratio as an important metric for growth efficiency of the company. Consider our Hubble case, the difference in CLV / CAC ratio in computing it using overall vs cohort based churn is a 3X. So Overall churn based CAC/CLV ratio overestimates the true ratio by 300%. In other words, computing CLV using the overall churn rate in may give the mistaken impression that the unit economics of a business are improving over time, even when in fact unit economics are deteriorating.
The exact opposite of what a good metric, should do. So re-read the title of this post and start plotting churn rates at a cohort level.
Sometimes metrics can’t be made simpler, no matter how much managers and investors crave simplicity.
References
McCarthy, Daniel, Barak Libai, and Verena Schoenmueller (2024), “The Declining Churn Fallacy over the Product Lifecycle,” https://papers.ssrn.com/abstract=4722115